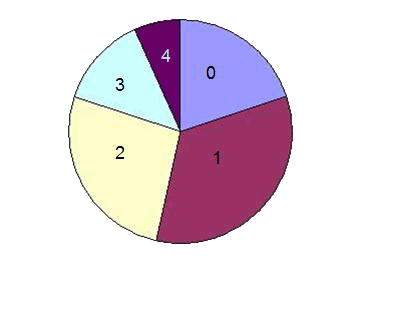
The diagram of sectors is usually used for qualitative variables, but it can also be used to represent discrete data.
It consists on dividing a circle so that the most frequent values have bigger sectors. To calculate the angle of the sector of each value we use the following expression:
where
The following table shows the value of the angle for every number of brothers using this example:
Example
| No. of brothers | Angle |
Notice that they add up to

