The histogram is a representation similar to the diagram of bars. It is usually used when the volume of data is larger, or when the variables are continuous.
Example
The heights, in meters, of a basketball team are the following:
The middle points of each interval are the classes marks.
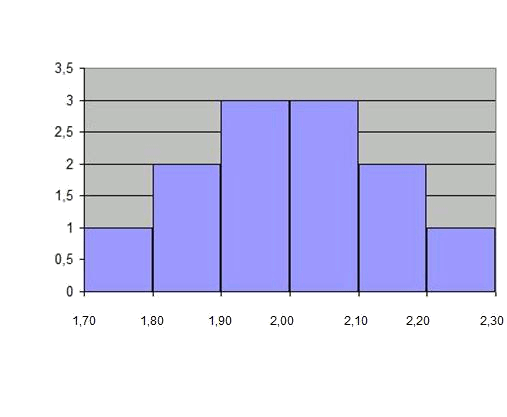
The diagram will be equivalent to a diagram of bars with the following data:
| Heights interval (or classes) | Mark of classes | Absolute frequency |
And the histogram is like a bars diagram, since the intervals have a constant size:

However, we can do histograms with different intervals. Let'suppose we want to see bars that indicate the quantity of players in each position.
If the lowest two players are bases, the following three guards, the following four forwards, and the three highest are centers. Which intervals can be defined?
| Position | Height interval |
| base | |
| guard | |
| orward | |
| center |
Notice that there are different intervals that can be defined.
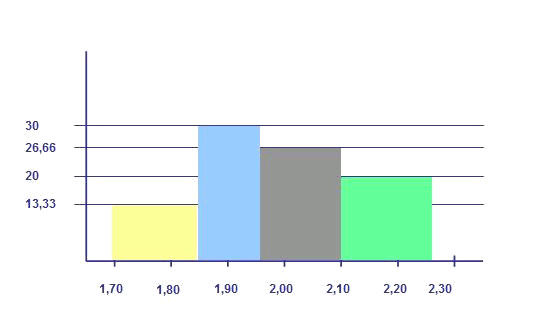
The representation of this new histogram is:

The heights of the rectangles are defined so that the area of each one has the value of the absolute frequency of the interval:
Note: All the representations explained in this level can be done with frequencies other than the absolute. For example, they can be done using relative frequencies (the histograms would have the same form but normalized heights), or using cumulative frequencies, so that the histogram would have an increasing form from
