Consider a function
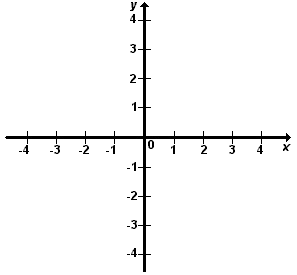
Observe the axis of coordinates of the figure. We represent in the

The graph of a function
In practice it is not possible to represent all the pairs
Example
Represent graphically the function
We start by constructing a table of several pairs
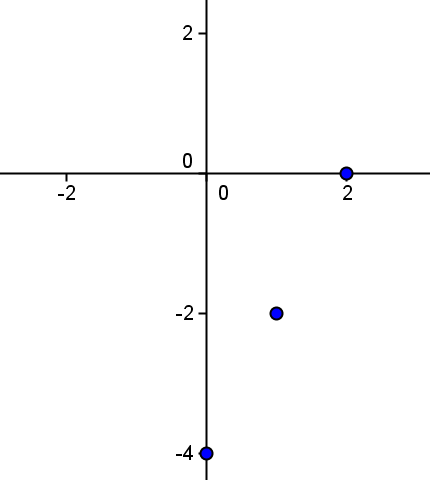
If we represent these points:

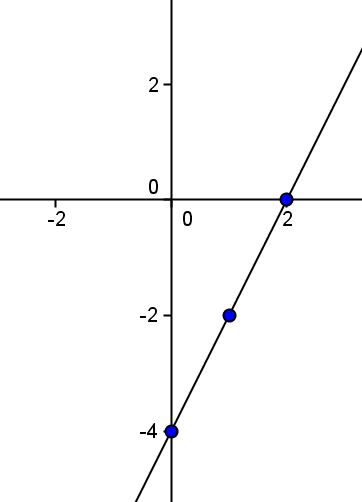
Finally, if we join them we obtain the straight line we wanted to represent:

It is important to bear in mind that, that not all the functions are continuous (for example the case of the functions defined by parts). In these cases it is necessary to indicate whether the point belong to the continuous line plotting the function or not. We will use following notation:
We will end the lines with a small dot.
- if the dot is full, it means that the point belongs to the graph of the function.
- if the circle is empty (that is, we have a small circle), it means that the point does not belong to the graph of the function.
Example
Observe the following function defined by parts:
In the point
We observe also that

